Pandas >> Reshaping Data and Analyze Data
Table of Contents
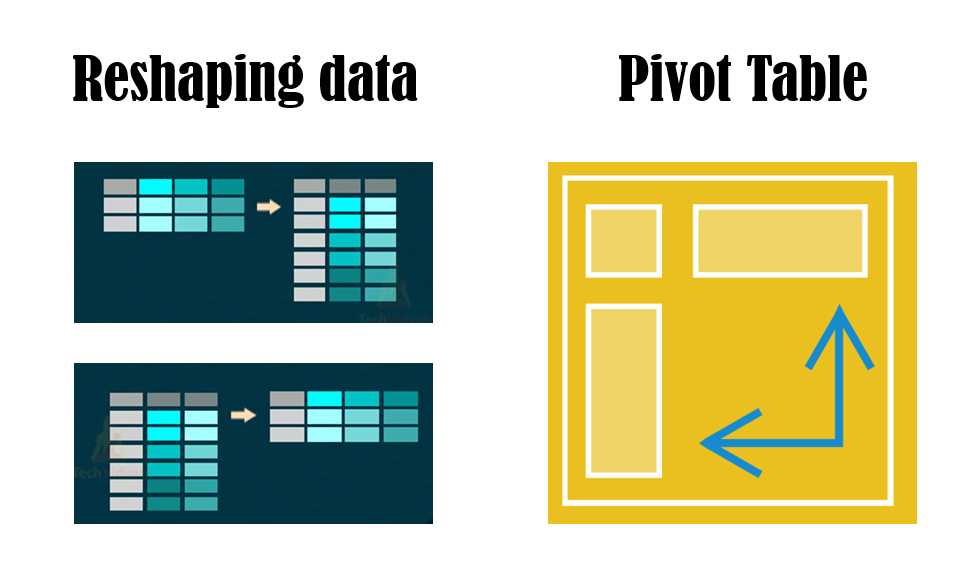
In this article, we will talk about how to reshaping data and analyze data using pivot, pivot_table, Stack, Unstack, Melt methods.

Reshape data using pivot()
When we want to organize the DataFrame by given index and column, we can use pivot() method of DataFrame.
Let’s prepare the data.
import pandas as pd

df = pd.DataFrame({
    "name": ["Kevin", "Kevin", "Kevin", "Mary", "Mary", "Mary", "Bob", "Bob", "Bob"],
    "course": ["A", "B", "C", "A", "B", "C","A", "B", "C"],
    "score": [66, 75, 80, 70, 77, 81, 80, 85, 90],
    "sex": ["M", "M", "M", "F", "F", "F", "M", "M", "M"],
})
df
As you can see, in order to represent the data in tabular form, the name of the same person and the course appear repeatedly in many rows.

If we want to show the score of each course for each student, we can write the code below.
df.pivot(index="name", columns="course", values="score")
index is the vertical axis, and columns is the horizontal axis, the value will display in each cell.

Pivot and aggregate data using pivot_table()
pivot_table can handle duplicate values for a pivoted index/column pair. Specifically, you can give pivot_table a list of aggregation functions using keyword argument aggfunc. The default aggfunc of pivot_table is numpy.mean.
If we want to count the number of courses and the mean of scores for each student, we can use the code below.
import numpy as np
pd.pivot_table(df, index="name", values=["course", "score"], aggfunc={"course": "count", "score": np.mean})
The index is the vertical axis, and values will be the names of columns, the cell value will be the result of aggregation for each column.

Reshape data using stack() and unstack()
If we want to stack the values of all columns (horizontal) to multiple rows (vertical), we can use stack() method of DataFrame.
For example, we have the DataFrame below.
In the DataFrame, all the courses of a student is displayed in horizontal direction as columns.
df = pd.DataFrame({
    "course_A": [60, 70,80],
    "course_B": [65, 75,85],
    "course_C": [70, 75,83],
}, index= ["Kevin", "Mary", "Bob"])
df

If we want to stack all the columns to vertical direction as multiple rows, we use stack() method.
df2 = df.stack()
df2

If we want to expand a column to multiple columns, we can use unstack() method.
The unstack() method is the inverse operation of stack() method.
For example, if we apply unstack() operation to the above DataFrame df2 we can get the original DataFrame df.
df2.unstack()

Reshape data using melt()
If we want to only keep some columns as key items of row and stack other columns into one column, we can use melt() method of DataFrame.
Similarly, let’s prepare the data.
df = pd.DataFrame({
    "name": ["Kevin", "Mary", "Bob"],
    "sex": ["M", "F", "M"],
    "course_A": [74, 85,90],
    "course_B": [65, 75,85],
    "course_C": [70, 75,83],
})
df

Let’s keep the name and sex column as key items of row and stack course_A, course_B and course_C into variable column.
df.melt(id_vars=["name", "sex"])

Conclusion
- pivot(): Reshape DataFrame by given index and column with index as vertical axis and column as horizontal axis. Duplicated values are not supported.
- pivot_table() : piovting data like Excel with aggregation of numeric data.
- stack(): stack multiple columns to one column of multiple rows and insert index.
- unstack(): expand one column of multiple rows to multiple columns
- melt(): stack multiple columns to one column of multiple rows and insert a column named ‘variable’.