How to Change Font Style and Size in Matplotlib
Table of Contents
Introduction
Matplotlib is a powerful Python library that allows users to create various visualizations. While creating these visualizations, it is often necessary to adjust the font style and size to improve readability and aesthetics. In this article, we will discuss how to change the font style and size in Matplotlib using various methods.
1. Changing font style and size for a specific element
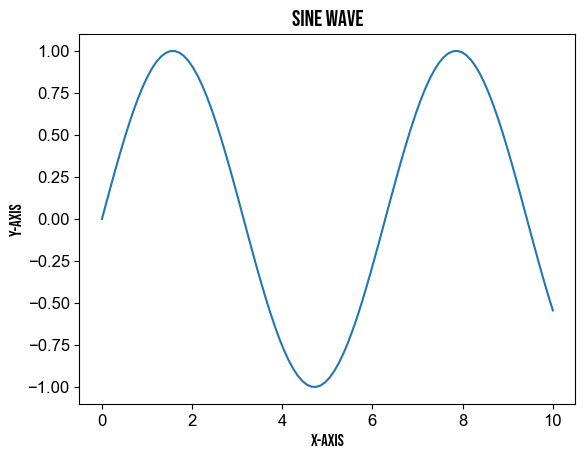
To change the font style and size for specific elements such as titles, axis labels, and tick labels, you can use the fontsize and fontstyle parameters in the corresponding functions.
import matplotlib.pyplot as plt
import numpy as np

x = np.linspace(0, 10, 100)
y = np.sin(x)

plt.plot(x, y)

# Set the title with custom font size and style
plt.title("Sine Wave", fontsize=16, fontstyle='italic')

# Set the axis labels with custom font size and style
plt.xlabel("x-axis", fontsize=12, fontstyle='normal')
plt.ylabel("y-axis", fontsize=12, fontstyle='normal')

plt.show()
2. Setting global font properties
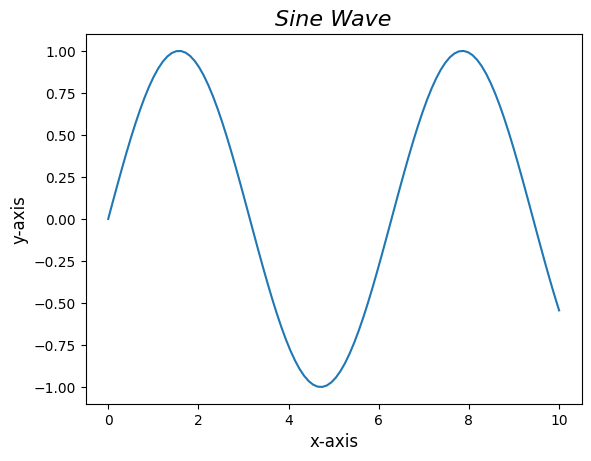
If you want to change the font properties globally, you can use the rcParams dictionary in Matplotlib. This allows you to set default font properties for all elements in your plots.
import matplotlib.pyplot as plt
import numpy as np

# Set global font properties
plt.rcParams['font.size'] = 12
plt.rcParams['font.family'] = 'Agency FB'
plt.rcParams['font.style'] = 'normal'

x = np.linspace(0, 10, 100)
y = np.sin(x)

plt.plot(x, y)
plt.title("Sine Wave")
plt.xlabel("x-axis")
plt.ylabel("y-axis")

plt.show()
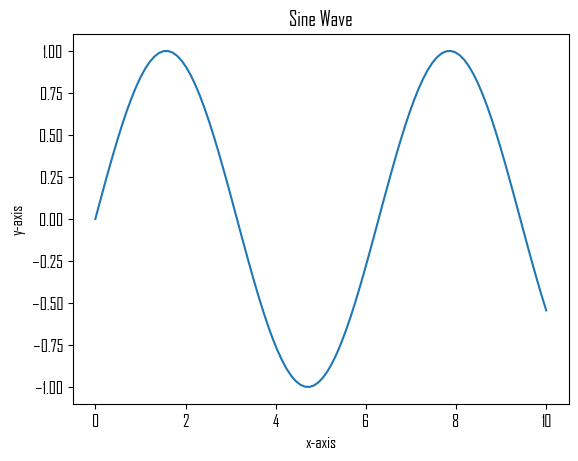
3. Working with custom fonts
To use a custom font in your Matplotlib plot, you can use the FontProperties class from the matplotlib.font_manager module. This allows you to load a font file (TTF or OTF) and use it in your plot.
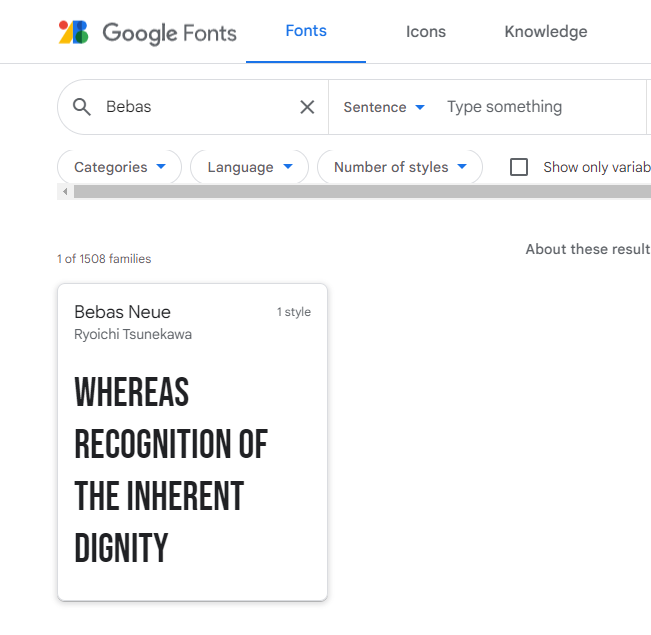
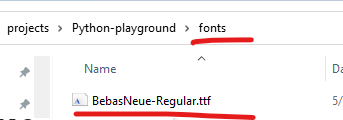
Firstly, let’s download a font from Google font and put the .ttf file to the fonts folder.
import matplotlib.pyplot as plt
import numpy as np
from matplotlib.font_manager import FontProperties

# Load custom font
custom_font = FontProperties(fname='fonts/BebasNeue-Regular.ttf')

x = np.linspace(0, 10, 100)
y = np.sin(x)

plt.plot(x, y)

# Set the title using custom font
plt.title("Sine Wave", fontproperties=custom_font, fontsize=16)

# Set the axis labels using custom font
plt.xlabel("x-axis", fontproperties=custom_font, fontsize=12)
plt.ylabel("y-axis", fontproperties=custom_font, fontsize=12)

plt.show()
We can find that title and axis label font have been changed to our custom font.