How to Set Legend Position in Matplotlib
Table of Contents
Introduction
Adjusting the legend position in Matplotlib plots is essential for enhancing readability and aesthetics. In some cases, the default legend location may overlap with the data, making it difficult to interpret the plot. By customizing the legend position, you can ensure it does not obstruct crucial information. Depending on the plot’s purpose, you may want to place the legend inside or outside the plot area. Choosing an appropriate legend location is crucial for creating informative and visually appealing plots, whether for presentations, reports, or sharing with colleagues.

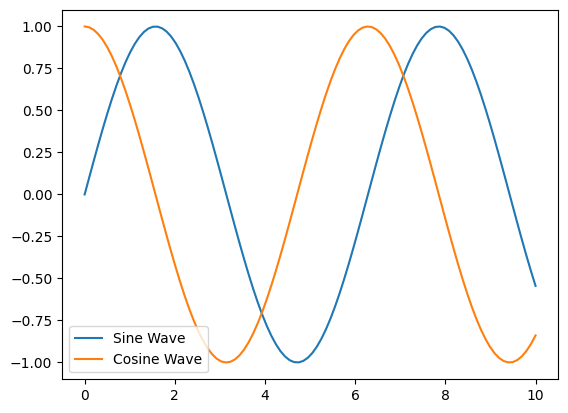
Default legend location
Use the legend() function without any arguments to create a legend with the default location. The default legend location is determined by Matplotlib to minimize overlap with the plotted data.
This is the code example.
import matplotlib.pyplot as plt
import numpy as np

x = np.linspace(0, 10, 100)
y1 = np.sin(x)
y2 = np.cos(x)

plt.plot(x, y1, label="Sine Wave")
plt.plot(x, y2, label="Cosine Wave")

plt.legend()

plt.show()
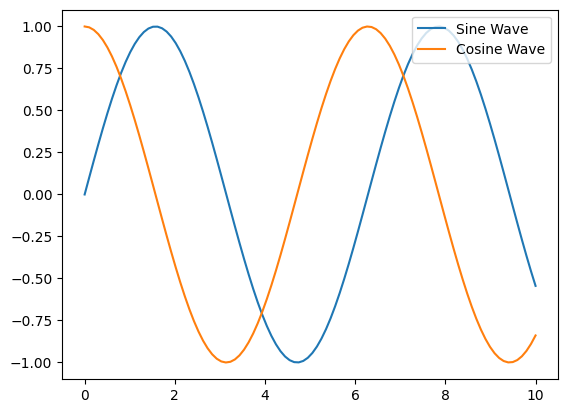
Custom legend location inside the plot
You can specify the location of the legend inside the plot using the loc parameter in the legend() function. The loc parameter accepts a string or an integer code.
Here are some common legend locations:
"best"
"upper right"
"upper left"
"lower left"
"lower right"
"center"
"center left"
"center right"
For example, if we want to move the legend to upper right corner, we can use the following code.
import matplotlib.pyplot as plt
import numpy as np

x = np.linspace(0, 10, 100)
y1 = np.sin(x)
y2 = np.cos(x)

plt.plot(x, y1, label="Sine Wave")
plt.plot(x, y2, label="Cosine Wave")

# Place the legend in the upper right corner
plt.legend(loc="upper right")

plt.show()
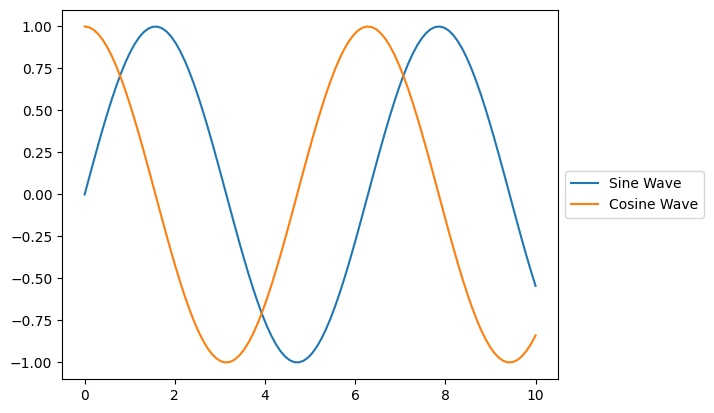
Legend outside the plot
To place the legend outside the plot, you can use the bbox_to_anchor parameter. It defines the bounding box of the legend in the axes coordinate system. The loc parameter is used in combination with bbox_to_anchor to specify the anchor point of the legend.
import matplotlib.pyplot as plt
import numpy as np

x = np.linspace(0, 10, 100)
y1 = np.sin(x)
y2 = np.cos(x)

plt.plot(x, y1, label="Sine Wave")
plt.plot(x, y2, label="Cosine Wave")

# Place the legend outside the plot, to the right
plt.legend(loc="center left", bbox_to_anchor=(1, 0.5))

plt.show()